Weekly Recap for 3/30/15 – 4/3/15

3/30: *$107,301.58
4/3: *$103,233.72
PL%: -2.70%

Got hammered this past week with a number of trades that went the wrong way. Perhaps the most frustrating trade was my short position on Palladium, which first started trending nicely but then whipped back within the range of the consolidated channel. Another frustrating trade was my short on Natural Gas, which also started off nicely before getting stopped out for a smaller loss. While Natural Gas broke the symmetrical triangle pattern, it bounced right off the support line of 2.585.

Despite the big loss for the week combined with the subpar performance in March, I know that more opportunities will present themselves in the future. I believe these tough times make the difference between traders who make it and those who don’t. You can’t get emotional, take the losses personally, get discouraged, and give up. I’m confident in my system and in myself and I look forward to a fresh week of opportunities.

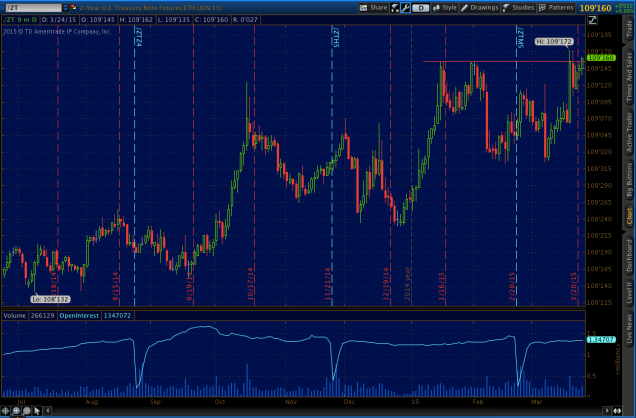
I carry three open positions into next week: long US 2-Year, short Cocoa, and short Oats.

*Numbers based off adjusted starting capital amount of $100,000
Monthly Recap for March

3/1: *$107,242.53
3/31: *$106,102.05
PL%: -1.06%

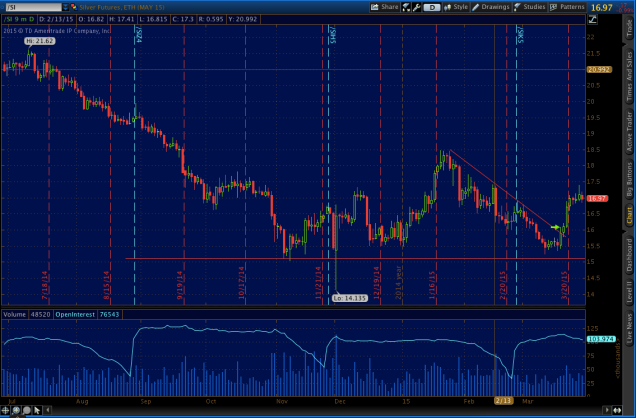
Best Trade of the Month: Silver, SI[K5], Long, +$2,850 per contract
Worst Trade of the Month: Palladium, PA[M5], Short, -$1,475 per contract

If you’ve been following my trades and weekly recaps this past month, you’ll know that it’s been choppy and stressful. Each time I approached the high watermark and inched past it slightly, my trading results hit a wall and I retreated and I close out this month on such a retreat. While I hit my target ratio of profitable/unprofitable trades (33%), I still experienced a down month. Since my capital risk per trade is still hovering around 1%, this makes me believe that I’m entering too many trades that have unfavorable risk/reward ratios (under 3:1). I caught myself entering a few trades with technical patterns of 1-month or less and have since cut those out.

My metals and indices trades performed the best while my grains and softs trades performed the worst. My shorts far outperformed my longs. I enter April with 6 open positions, Long in US 2-Year and Live Cattle, and Short in Palladium, Natural Gas, Cocoa, and Sugar.

I’m currently up +10.40% YTD.

*Numbers based off adjusted starting capital amount of $100,000
Weekly Recap for 3/22/15 – 3/27/15

3/22: *$106,955.64
3/27: *$107,301.58
PL%: +0.31%

Screen Shot 2015-03-27 at 6.11.49 PM

Although the numbers from the start and end of this week don’t show it, the first few days of trading this week was gut wrenching. Including last week, I had entered and exited in 6 losing trades which combined for just under 5% of total capital. I knew this was all part of the system, kept my cool, and stuck to my guns. I believe in my system and know it will work in the long term.

Nearly all of the losses were made up in a single trade which I still have open, long Silver (chart included above, entry marked with green arrow). I managed to catch the big move up on the 20th and it’s slowly inched up this week. My other positions in long Live Cattle, long US 2-Year, and short Natural Gas have made much smaller moves.

I’m back to roughly even for the month of March and up +11.65% YTD.

*Numbers based off adjusted starting capital amount of $100,000
Natural Gas, 3/26/15

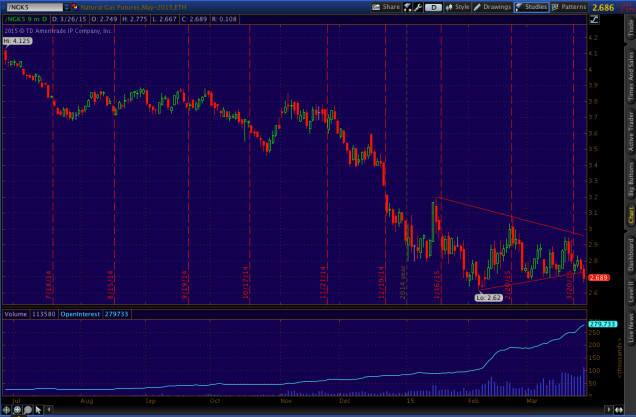
NG[K5], Short, Symmetrical Triangle
Entry: 2.69
Stop: 2.78
Target: 2.45 / 2.1
Risk/Reward Ratio: 2.67

Screen Shot 2015-03-26 at 5.13.09 PM

2-month symmetrical triangle pattern. While I’ve been avoiding energies and currencies, gave this trade a go as the chart structure looks sound and the risk level is manageable. Volume for the front April contract is starting to drop off so entered this position with the May contract.

With this position, now have four open positions, the other three all long in Silver, US 2-Year, and Live Cattle.